Debug app
Since the rendering of the 3d content is remotely drawn and managed by the 3dverse platform, debugging your application can be a bit different compared to traditional web applications.
Use the 3dverse editor for debugging
This article will not cover debugging techniques of your own application code, but rather focus on how to debug issues related to the 3dverse platform, network interactions, and performance bottlenecks.
Livelink always connects to a rendering session on the 3dverse platform, which you can also open in the 3dverse editor.
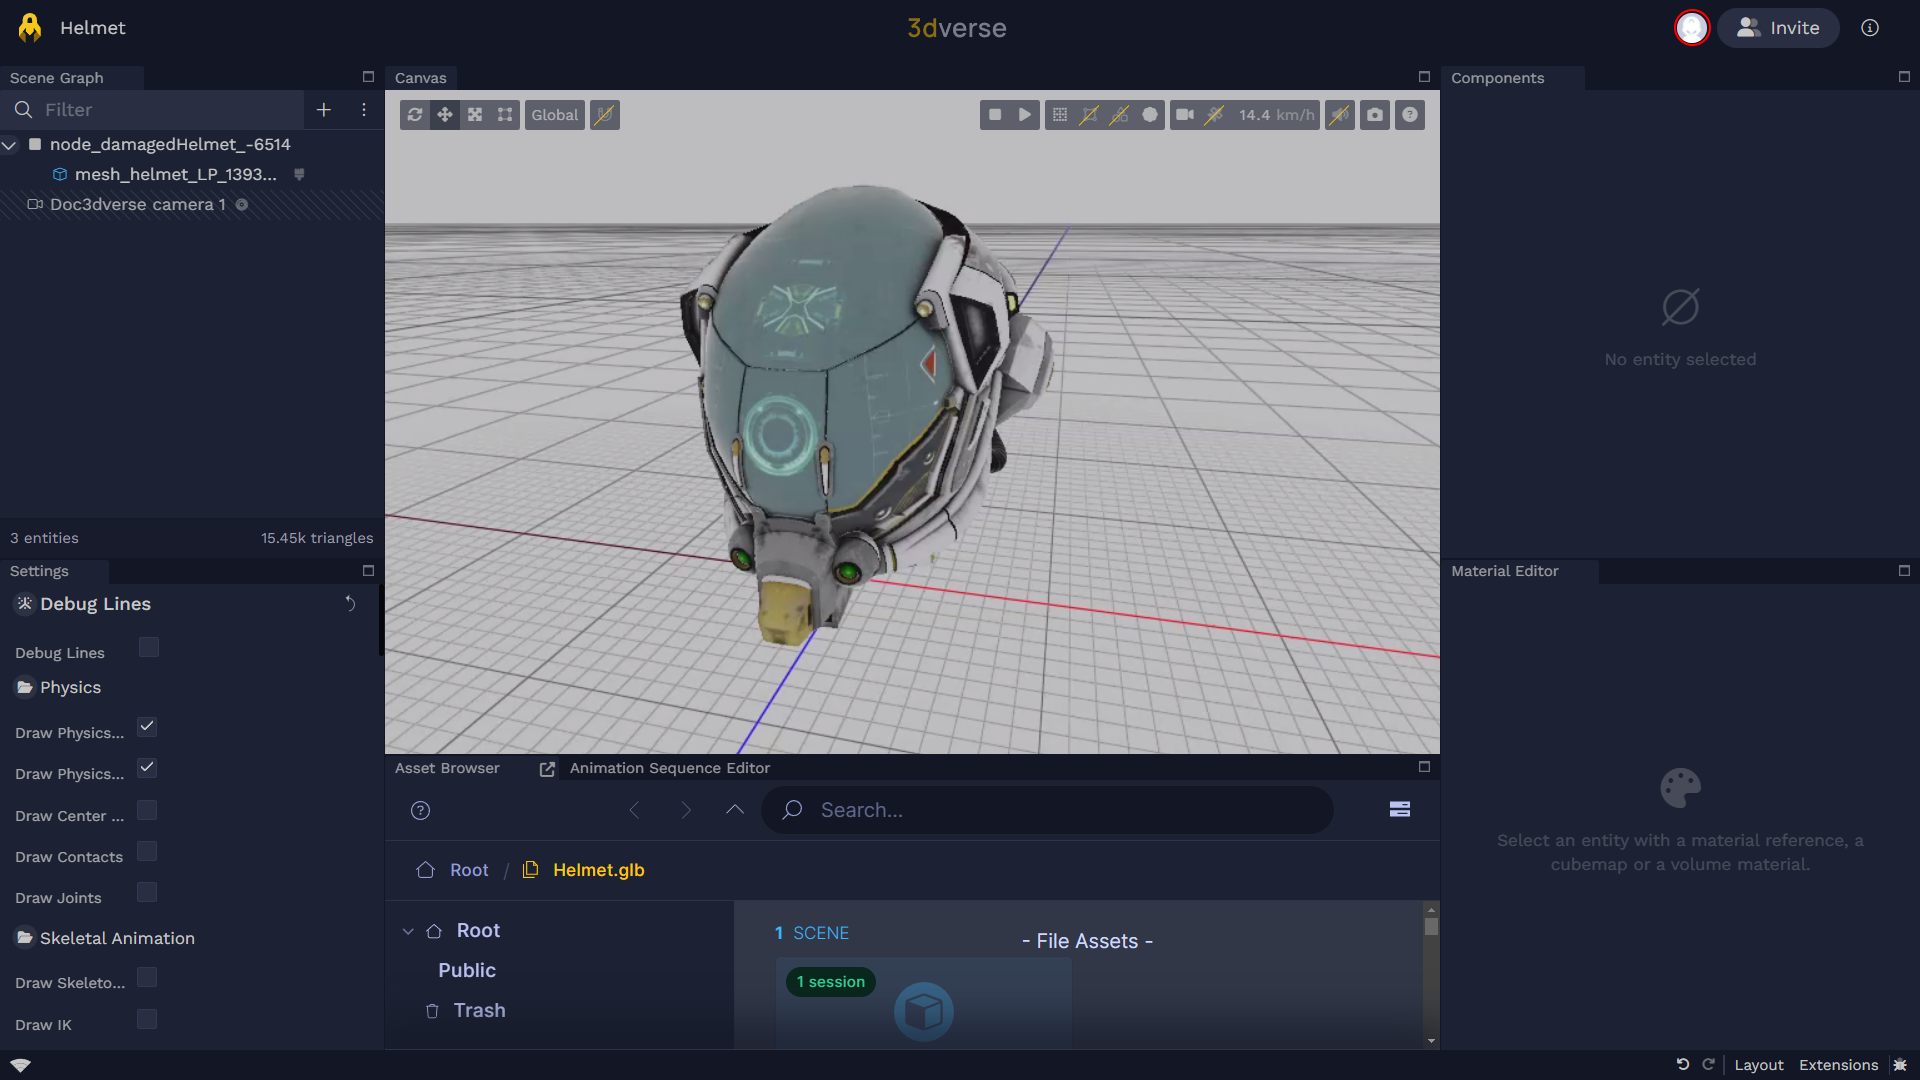
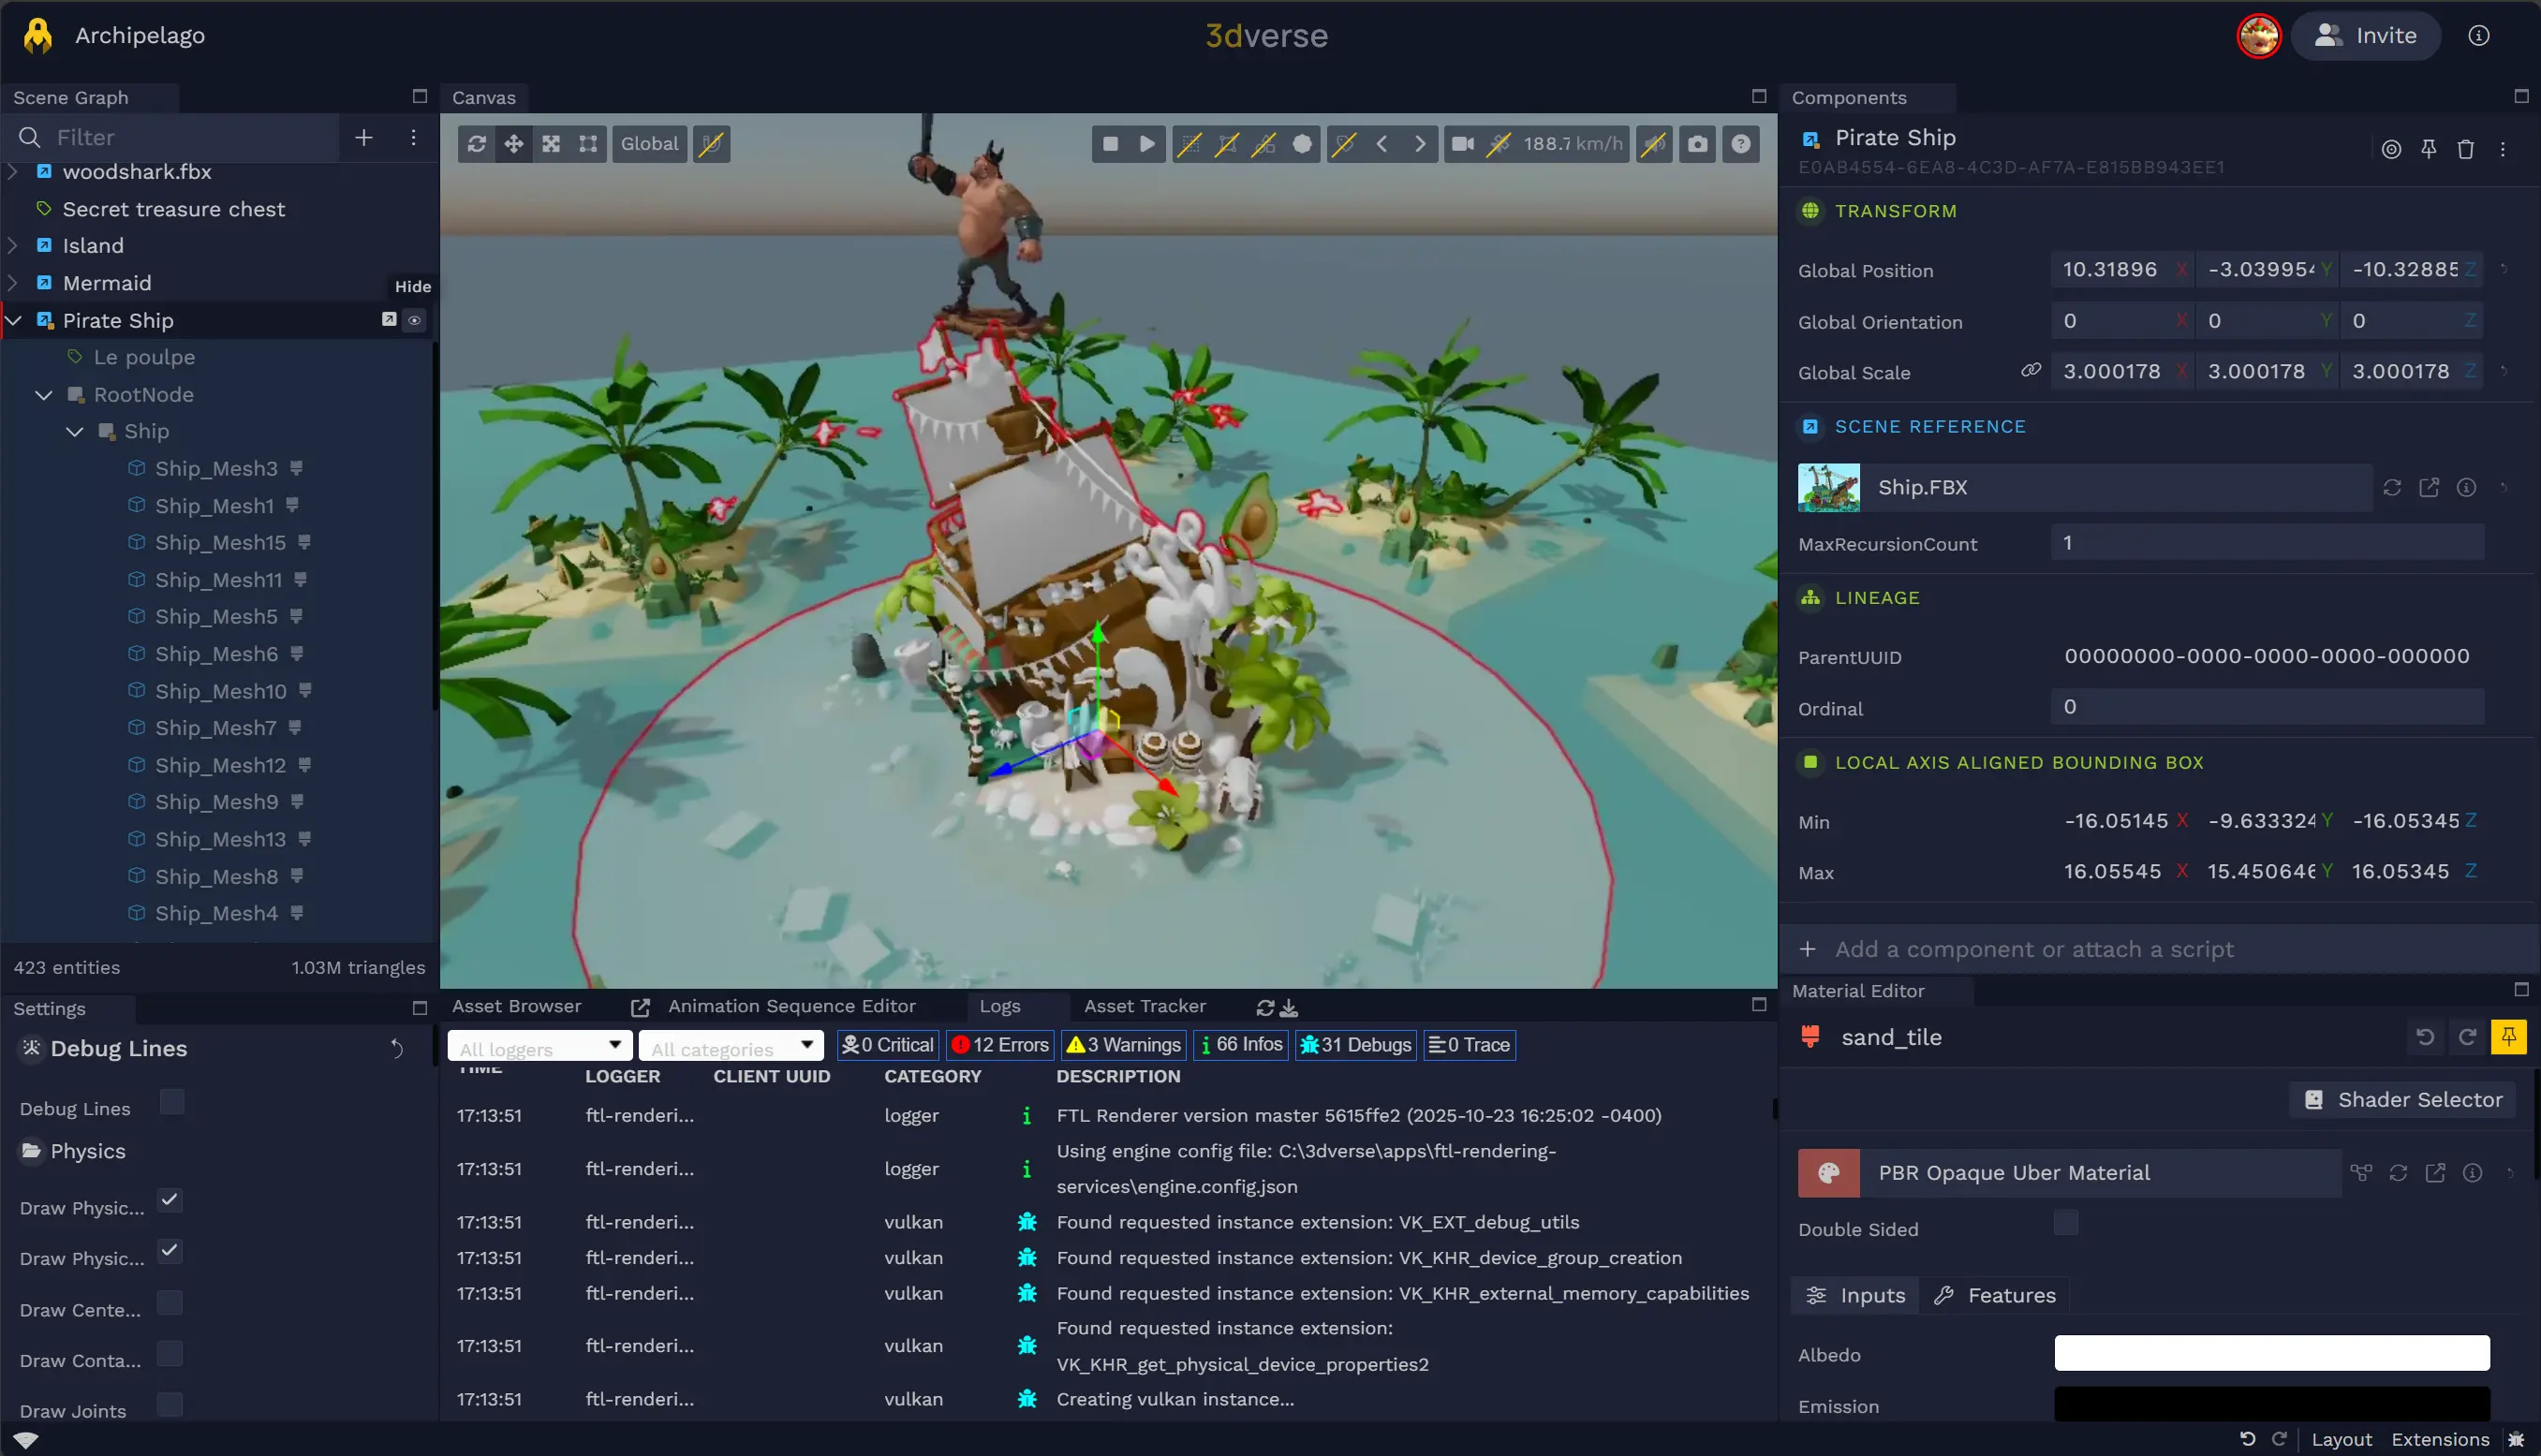
From the editor, you can:
- Use the Scene graph to browse the entities through their hierarchy
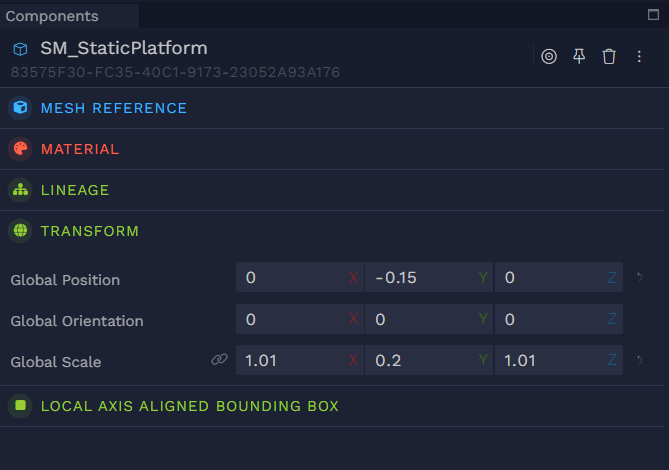
- Inspect and modify Components on entities
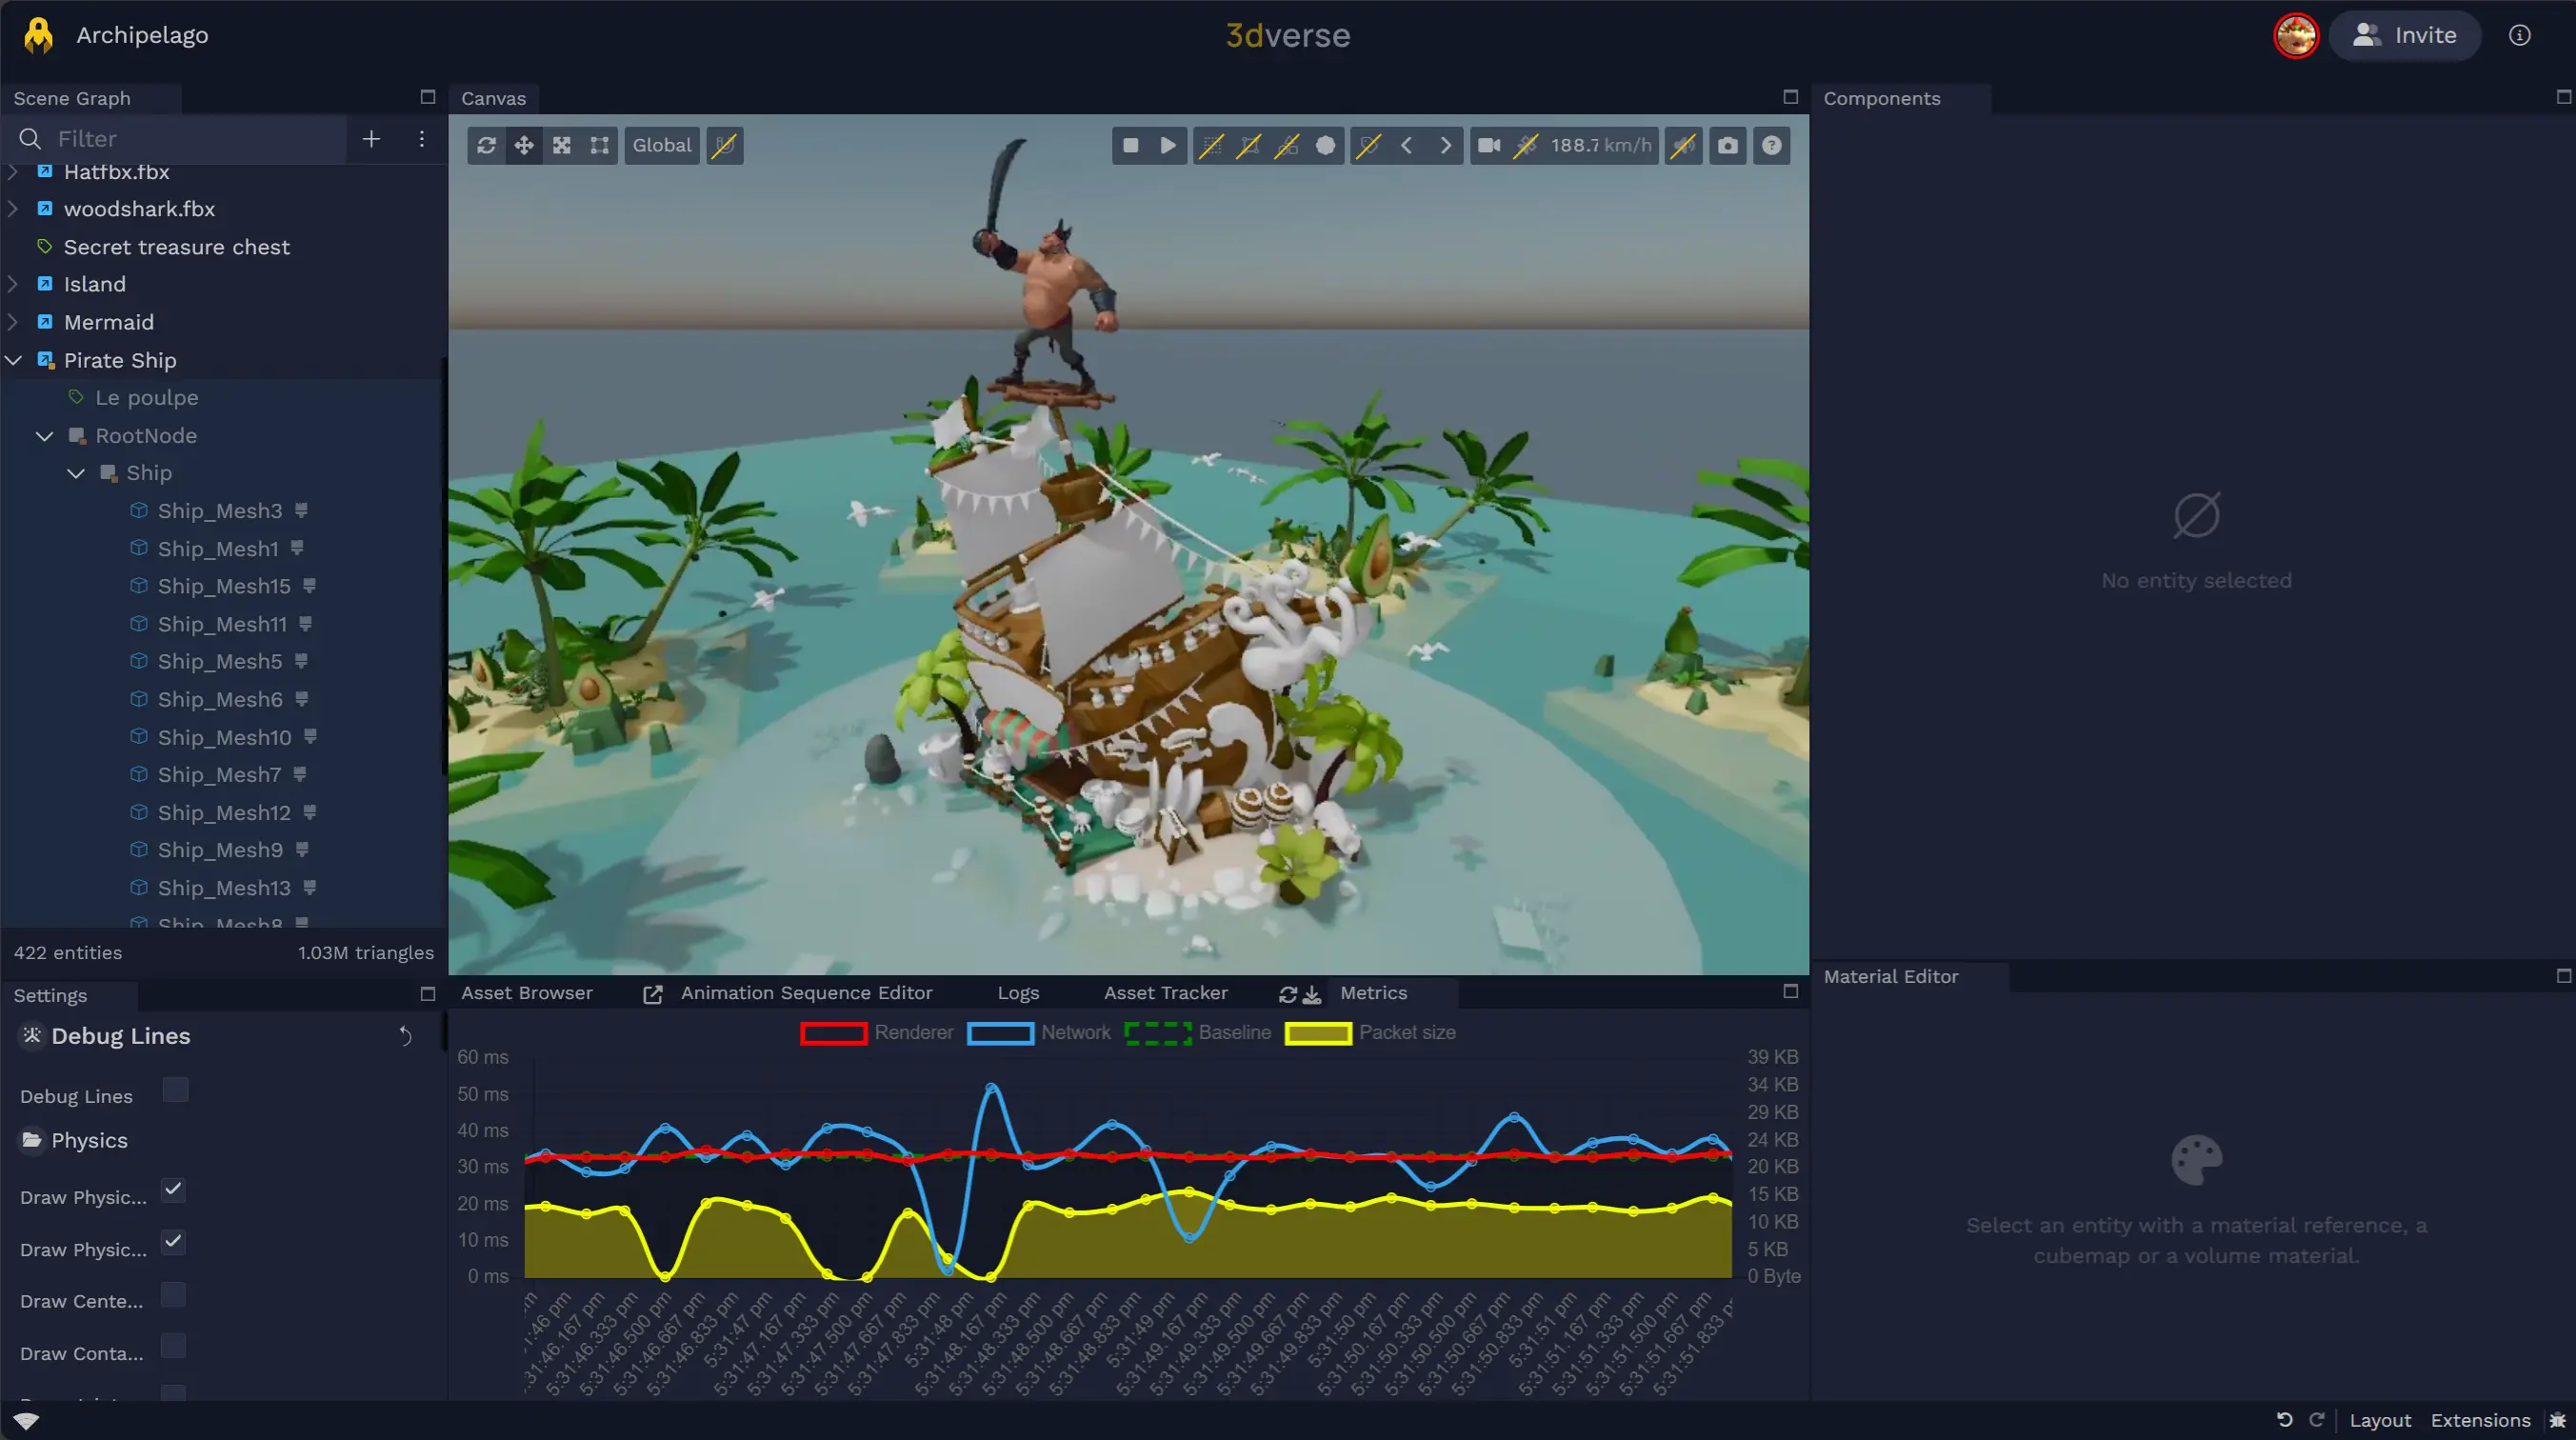
- Monitor the performance of your scene by looking at the metrics panel
- Use the material editor to tweak materials in real-time
- Read renderer logs and errors from the Logs extension
- Open the GPU Memory profiler to inspect memory usage
- See connected clients and see the scene from their perspective
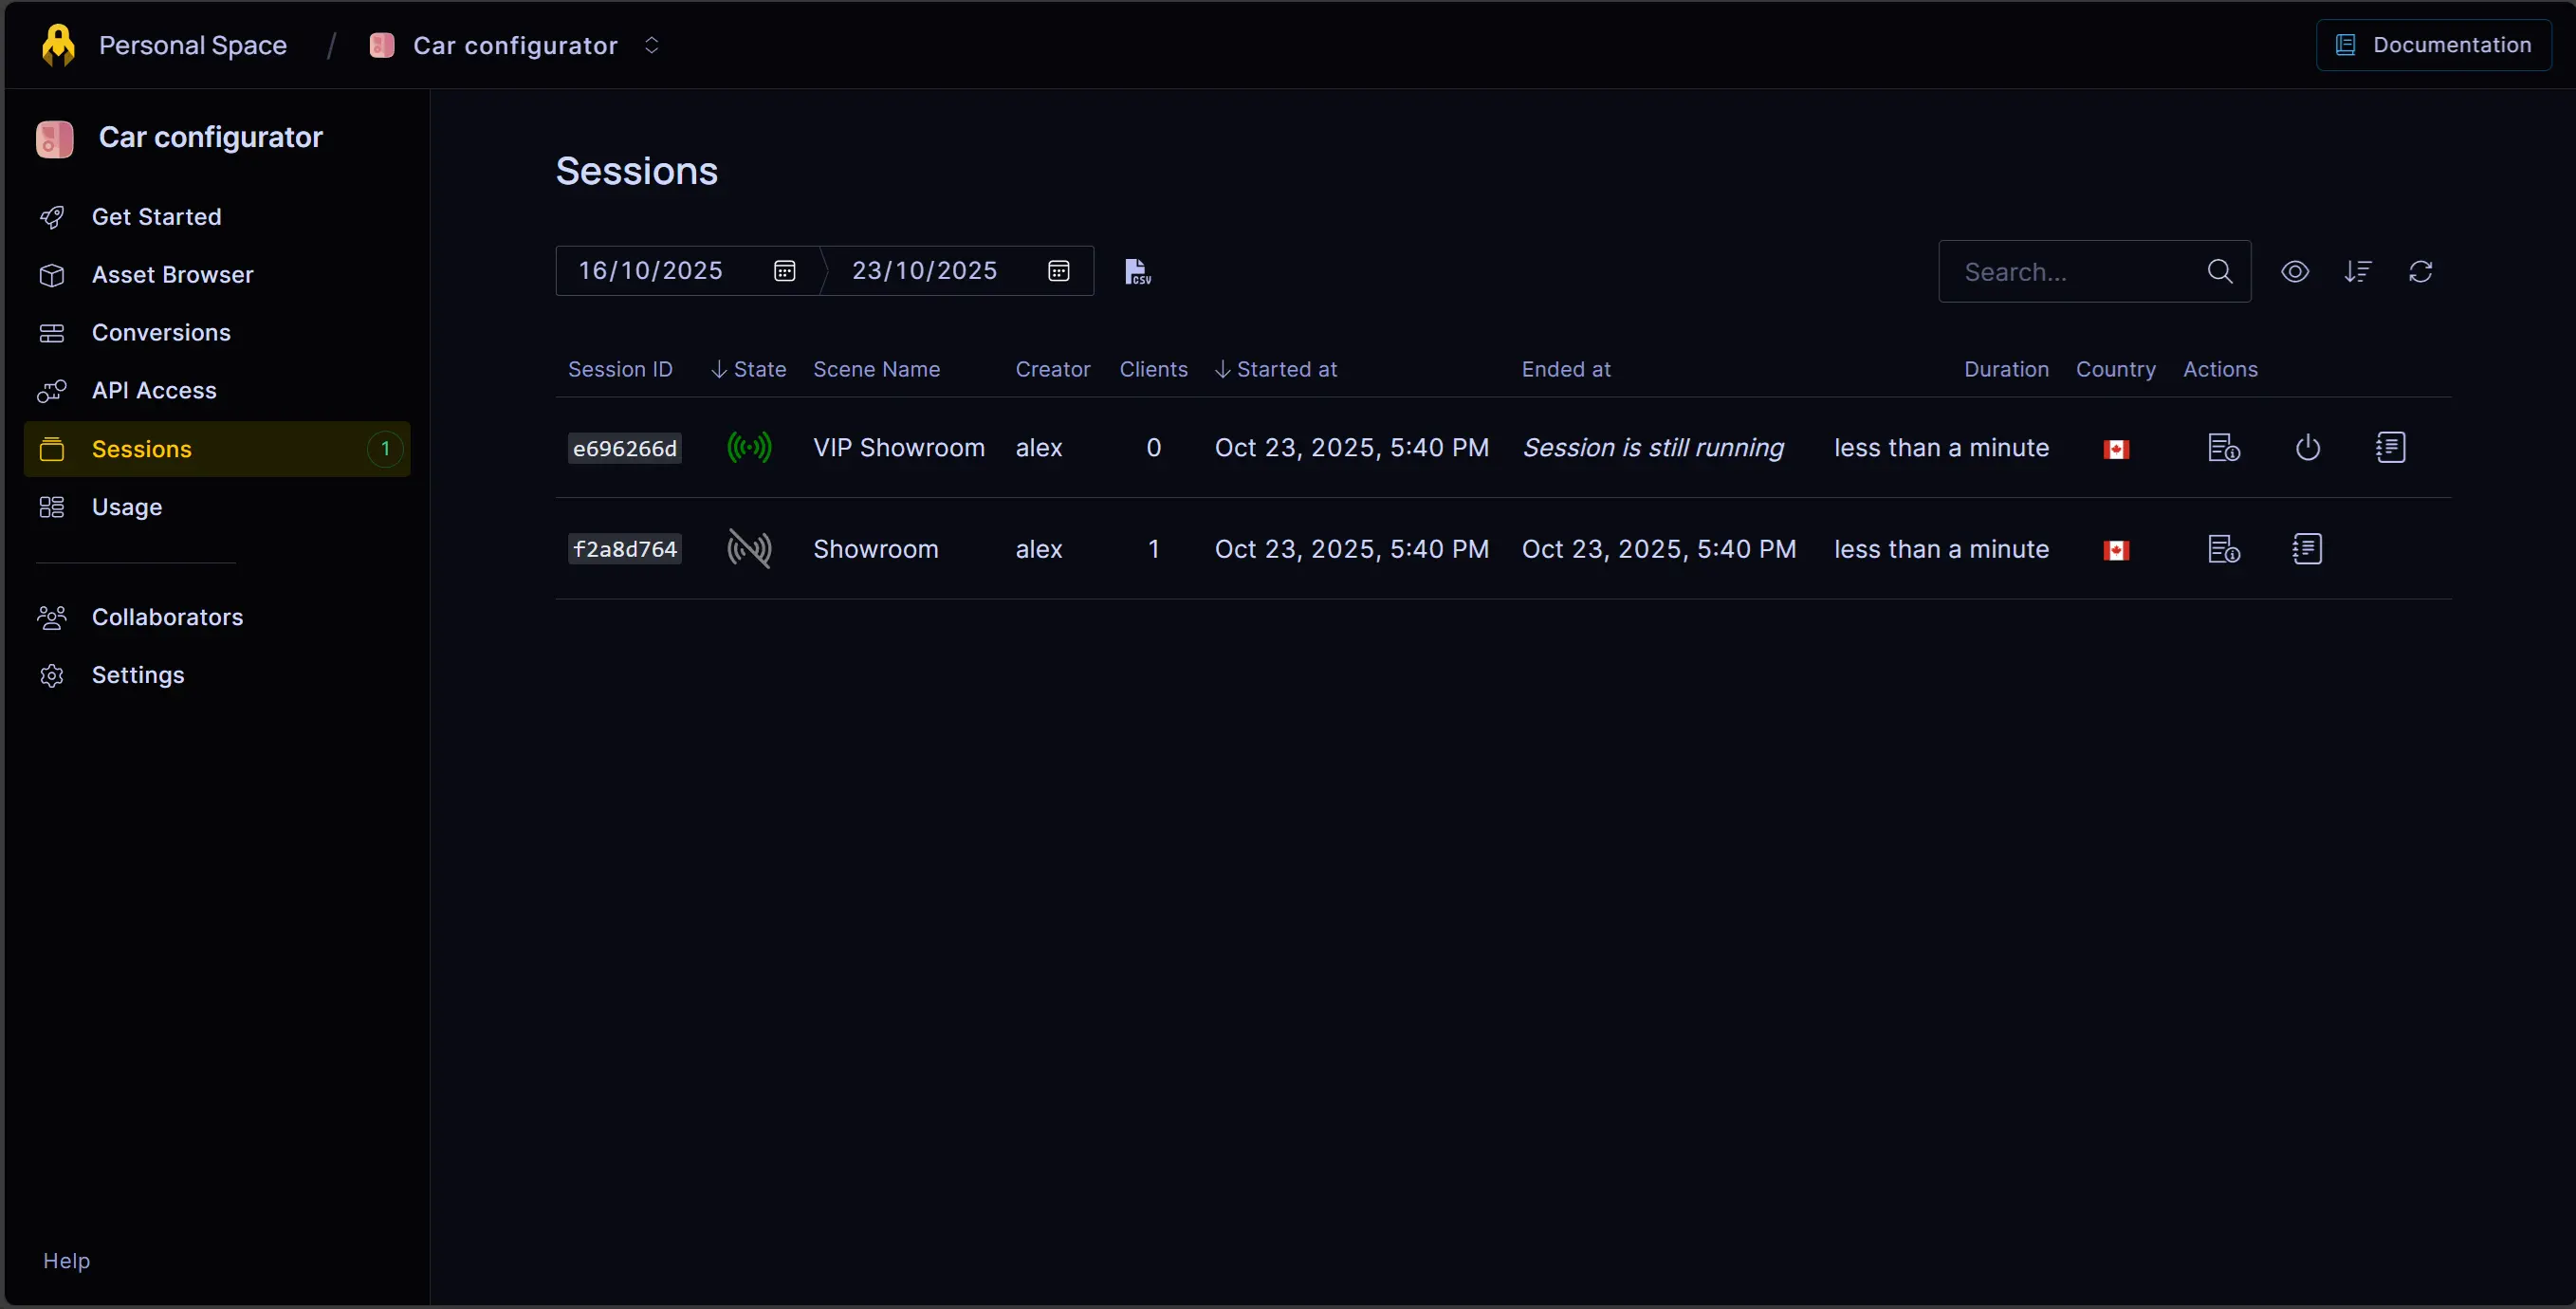
Join active sessions
While browsing the sessions from the 3dverse console, you can join any active session in the editor by clicking on it.
Hide entities
When debugging complex scenes, if you want to focus on specific entities, you can hide other entities temporarily.
To do this, hover over the entities you want to hide in the scene graph, then click on the eye icon Hide
.
This can also help you identify if certain entities are causing performance issues or rendering problems.
Using performance panel in your Application
livelink-react-ui provides a built-in performance panel to help you monitor your application's performance in real-time.